Agents
Agents perform routines and processes on behalf of users, either autonomously or semi-autonomously. These routines correspond to Kindo’s use cases and frequently take the form of DevSecOps playbooks, runbooks, ITOps routines, or standard operating procedures.
Kindo agents are unique in that they can understand and utilize natural language when executing tasks. An agent can read a human-written document and use that information to inform its behavior, and can translate natural language intentions into programmatic actions such as API calls.
Types of Agents
Kindo supports five agent types:
| Type | Trigger | Use Case |
|---|---|---|
| Chatbot | User message | Knowledge base Q&A, helpdesk |
| Manual Workflow | Manual run | Runbook execution, report generation |
| Scheduled | Cron schedule | Recurring reports, periodic checks |
| Triggered | External event | Incident response, alert triage |
| Dashboard | Implicit | Data visualization and monitoring |
Chatbots
A chatbot is an agent designed to respond to users with information gathered from its AI model and a set of knowledge base data.
Example: A helpdesk agent that answers questions about the setup process for a new company laptop or management of a development environment.
Manual Workflow Agents
A manual workflow agent conducts a set of operations within a system of record. Like chatbots, workflow agents can utilize natural language resources such as knowledge bases, files, and articles. Additionally, workflow agents can source data from external sources via API calls and employ external tools to perform actions.
Example: An agent designed to manage and deploy a development infrastructure on a cloud platform.
Scheduled Agents
A scheduled agent is a workflow agent that runs automatically on a cron schedule. These agents are ideal for recurring tasks like daily reports, weekly compliance checks, or periodic data synchronization.
Example: An agent that generates a weekly vulnerability report every Monday at 9 AM.
Trigger Agents
A trigger agent is a special type of workflow agent that lies dormant while waiting for a specified event to occur — such as a new entry in a ticketing system — before launching a response. When the trigger event is detected, data from the event can be used by LLMs within the agent for analysis and decision-making.
Example: An agent that performs first-order root cause analysis for a platform engineering incident.
Dashboard Agents
Dashboard agents are implicitly created when you build dashboards in Kindo. They handle data visualization and monitoring displays. These agents are typically not created directly but are part of the dashboard creation workflow.
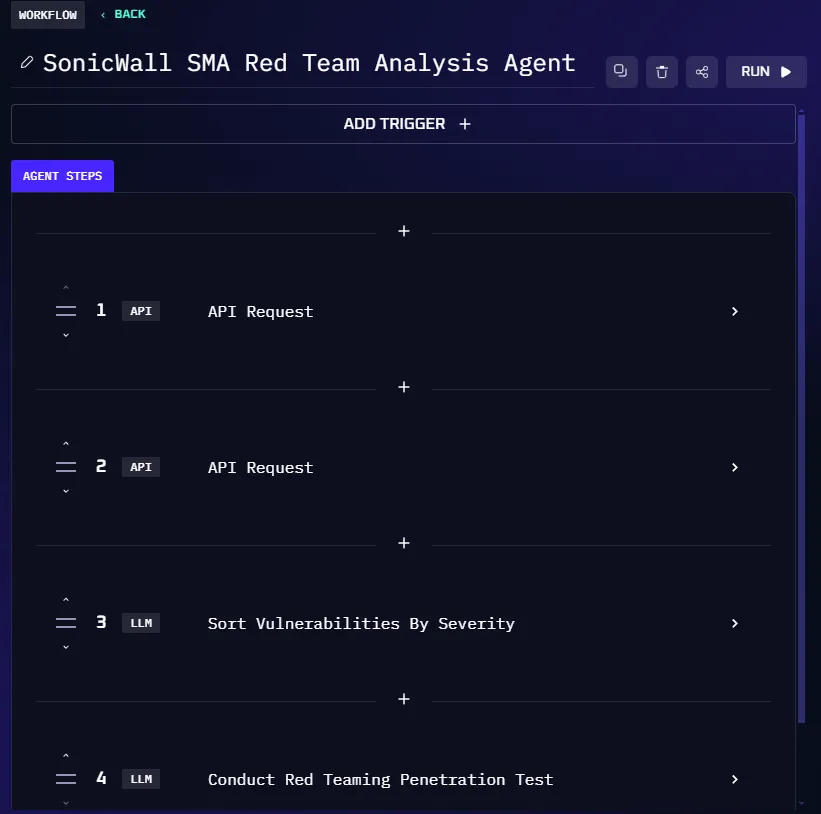
Agent Steps
Agents are collections of Agent Steps: atomic operations conducted by Kindo on behalf of the user.
Kindo supports two step types:
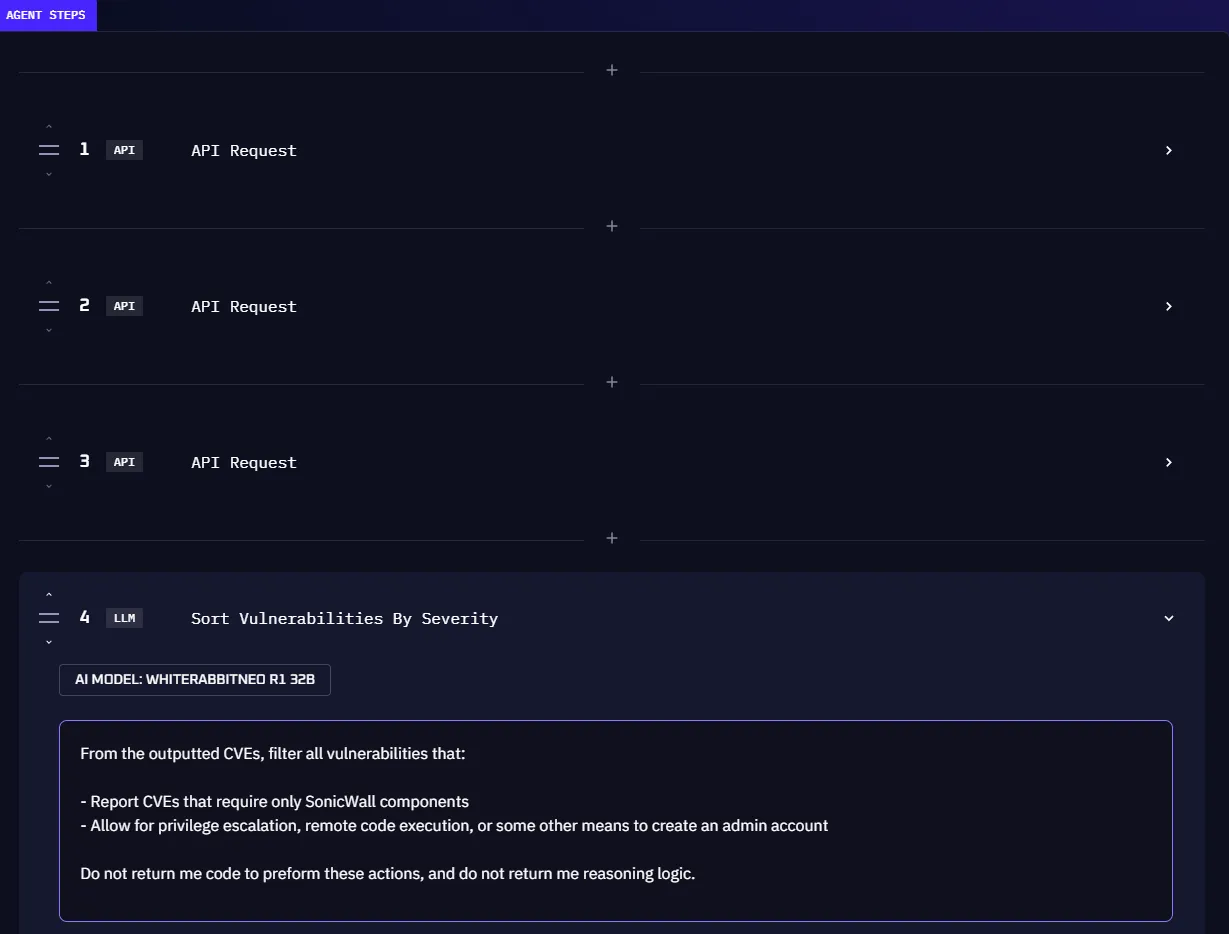
LLM Step
A step that requests a response from a permitted LLM. LLM steps are typically used for analysis, sorting information, and processing data gathered by previous steps.
API Action Step
An operation where the agent makes a REST API call to request information or change state in an external system. API requests can be manually configured or generated from a natural language prompt using the Magic button.
Note on Integration Actions: When working with integrated systems like Jira or ServiceNow, you may see pre-built actions in the UI (like “add comment” or “change priority”). These are convenience shortcuts that use the integration’s MCP tools behind the scenes — they are not a separate step type in the Kindo engine. Under the hood, they are API Action steps configured for that specific integration.
Agent Memory and Coordination
As you scale from single agents to production systems, you’ll need patterns for agent memory and multi-agent coordination:
- Memory and Persistence Patterns — Give agents persistent memory across runs using external systems and platform features
- Multi-Agent Coordination — Orchestrate multiple agents to work together on complex workflows
Next Steps
- Create and manage agents for step-by-step instructions
- Configure integrations to connect agents to external systems
- Build Your First Workflow for a hands-on multi-step workflow tutorial