Canvas
Kindo Canvas lets you create interactive dashboards powered by your connected integrations. Describe what you want in natural language, and the AI builds a live dashboard complete with data visualizations and actionable controls.
How It Works
Canvas dashboards are built in three steps:
- Connect integrations — Navigate to your integrations settings and connect services like Linear, GitHub, Jira, Salesforce, and more. These become live data sources for your dashboards.
- Describe your dashboard — Write a natural language prompt describing the data you want to see, how it should be laid out, and what actions you need.
- Interact with live data — View, filter, and act on your data directly from the dashboard.

Dashboard Generation
When you request a dashboard, the system:
- Gathers context from your connected integrations — what data is available, its structure, and how to query it.
- Generates a configuration including data source definitions, transformation rules, component layouts, and action definitions.
- Collects and presents data by executing integration tool calls, applying filters, and rendering the results.
Dashboard Components
Canvas offers three main component types:
Stats Cards
Display single metrics and KPIs at a glance. Each card shows a label, value, and optional unit (e.g., “Total Issues: 42”). Group multiple cards in a row for side-by-side comparison. Best for key metrics, counts, summaries, and status indicators.
Tables
Display structured data in rows and columns with support for various column types (text, numbers, dates, links, badges). Tables support inline actions on each row (buttons, dropdowns), expandable row details, and optional row counts in the title. Best for lists of items, detailed records, and data that needs action.
Accordions
Collapsible sections that expand to reveal details. Support markdown formatting for rich content and can display data as grids, tables, or raw format. Best for grouped information, hierarchical data, and detailed explanations.
Data Sources
Each dashboard component pulls its data from one of three source types:
Static Values
Hardcoded values defined directly in the dashboard configuration. Useful for labels, fixed thresholds, or placeholder content that doesn’t need to be fetched from an integration.
Tool Calls
A single integration tool call that fetches data at render time. For example, calling a GitHub tool to list open pull requests or a Linear tool to fetch issues. You can attach a JSONata transformation to reshape the raw tool response before it reaches the component — for example, extracting a nested array, renaming fields, or computing a derived value.
Chained Tool Calls
An ordered pipeline of up to 5 tool calls that execute sequentially. Each step can reference the output of any previous step, enabling multi-hop data fetching. For example:
- Step 1: List all projects from Linear.
- Step 2: For each project, fetch its issues (referencing Step 1’s output).
- Step 3: Aggregate issue counts by status.
Each step can include its own JSONata transform, and a final transform can be applied to the entire chain’s output. Steps can also be conditionally skipped if a previous step returned empty results.
JSONata Transformations
JSONata expressions let you reshape, filter, and compute over raw tool responses without writing code. They can be attached to individual tool calls, individual chain steps, or as a final transform on a chained pipeline. This is how the AI tailors raw API data into the exact shape each component expects.
Actions
Canvas dashboards support four types of actions that let you operate on your data directly:
Normal Actions
Operate on individual items via the connected integration. These appear as buttons or dropdown menus on each table row. Examples: change a task’s status, assign an issue, add a label, or close a record.
Client Actions
Quick actions that run in your browser without calling the integration — for example, opening a link to view the item in its source system.
Row Actions
Launch a dedicated AI agent to handle complex operations on a specific row. Unlike normal actions that execute a single tool call, row actions start a full agent conversation pre-loaded with the row’s data. The agent can reason about the data, make multiple tool calls, and carry out multi-step workflows. Examples: draft a response to a support ticket, generate a summary for a project, or triage an incident.
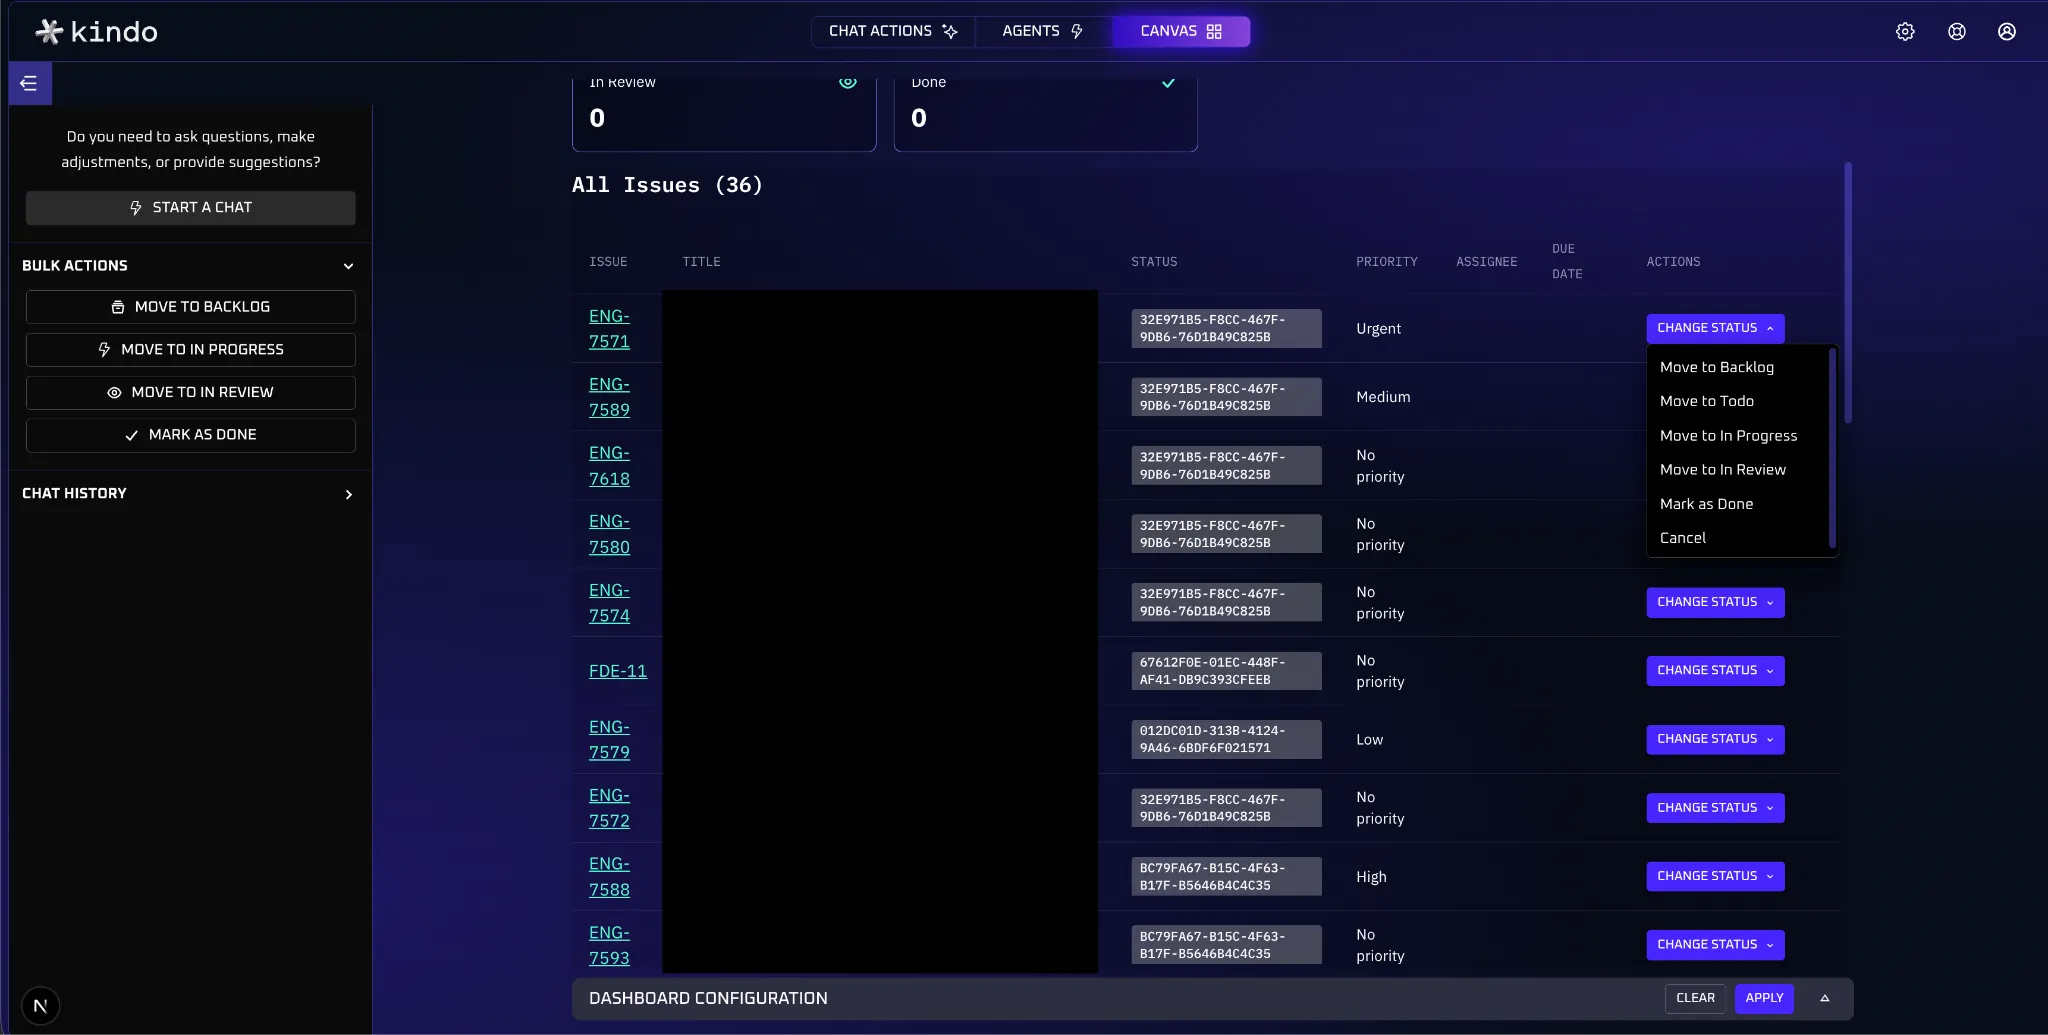
Bulk Actions
Operate on multiple items at once by running a configured bulk workflow from the sidebar. Examples: close multiple issues, assign several tasks, or apply a label to a batch of records.
To use bulk actions:
- Open the Bulk Actions panel in the dashboard sidebar.
- Choose the action you want to run.
- Review and optionally edit the action configuration in the confirmation modal.
- Click Execute to run the bulk workflow.
Writing Effective Prompts
The quality of your dashboard depends on your prompt. Be detailed and specific:
| Area | ❌ Vague | ✅ Specific |
|---|---|---|
| Data source | ”Show me my issues" | "Show all open GitHub issues from the ‘frontend’ repo assigned to me” |
| Layout | ”Create a project dashboard" | "Create a dashboard with stat cards for open, closed, and total issues, then a table with title, assignee, priority, and due date columns” |
| Filters | ”Show Linear tasks" | "Show Linear tasks from the ‘Engineering’ team in ‘In Progress’ or ‘In Review’ status, sorted by due date” |
| Actions | ”I want to update things" | "Add a dropdown on each row to change status to ‘Open’, ‘In Progress’, ‘In Review’, or ‘Done’. Add a bulk action to assign multiple issues at once.” |
Example Prompt
Create a dashboard for managing Linear issues assigned to me in the Engineering project.
Create a table with columns for: issue identifier (as a link to Linear), title, status (as a badge), priority, assignee, and due date.
On each row, add a “Change Status” dropdown with all available workflow statuses. Add bulk actions to change the status of multiple issues at once. Show the total row count in the table title.
Tips for Effective Dashboards
- Start with clear objectives — Define exactly how you imagine the dashboard to look. The more specific your prompt, the better the output.
- Choose the right components — Stats cards for KPIs, tables for actionable data, accordions for grouped information.
- Design for action — Include actions that help you work with your data, not just view it.
- Use meaningful labels and units — Specify units like %, USD, or hours when requesting numeric data.
- Iterate and refine — Use the chat to continuously improve: “Add a filter for high-priority items,” “Change status to colored badges,” or “Replace the description column with due date.”
Walkthrough: Building an Actionable Dashboard
Here’s an end-to-end example of creating a dashboard with status update actions:
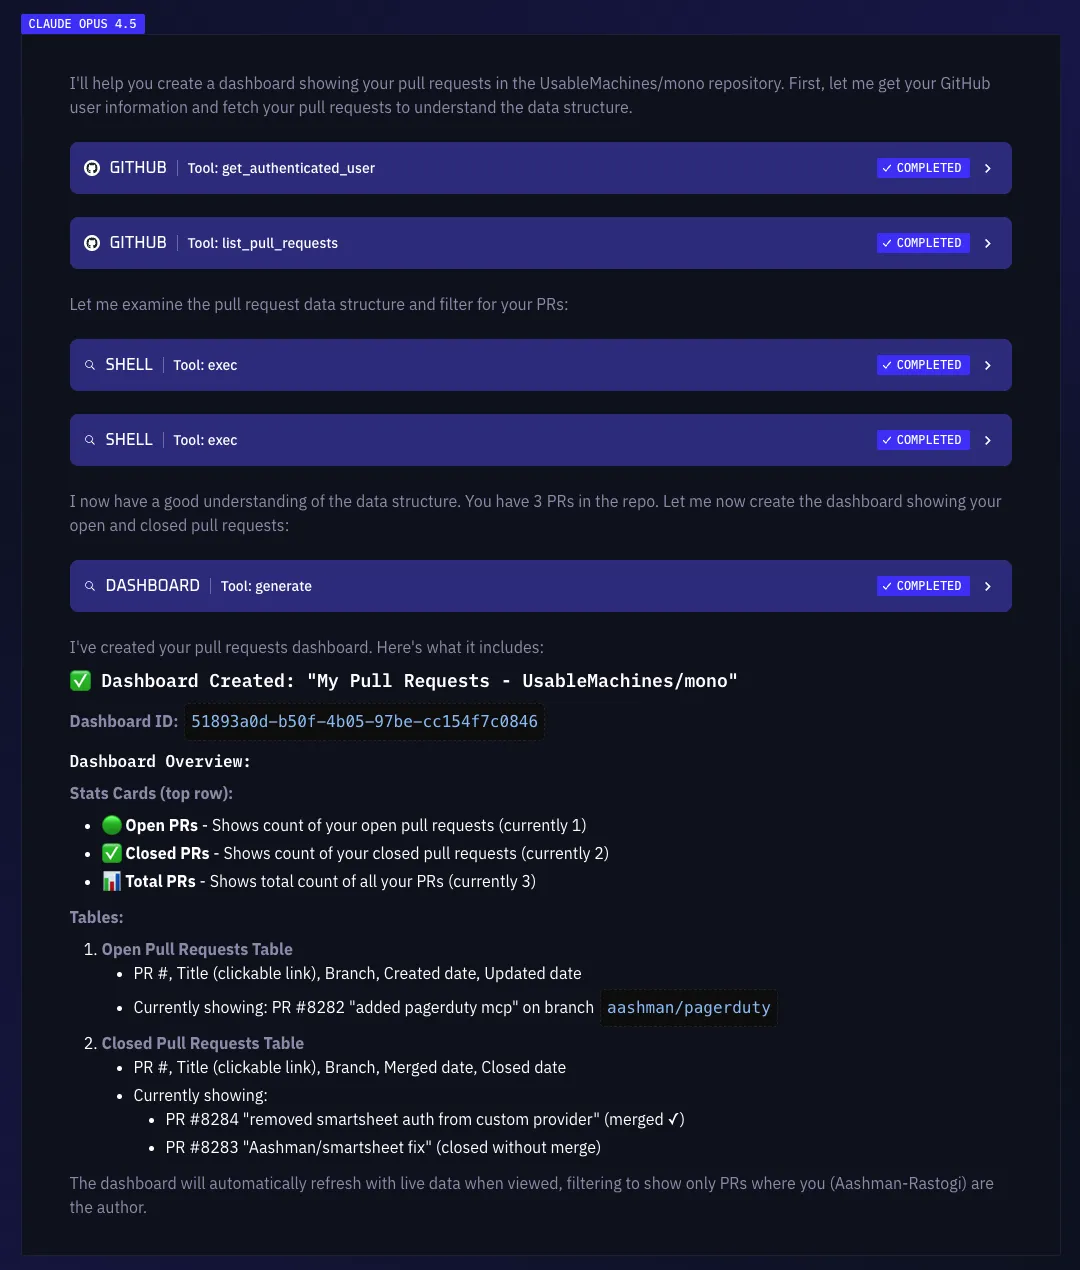
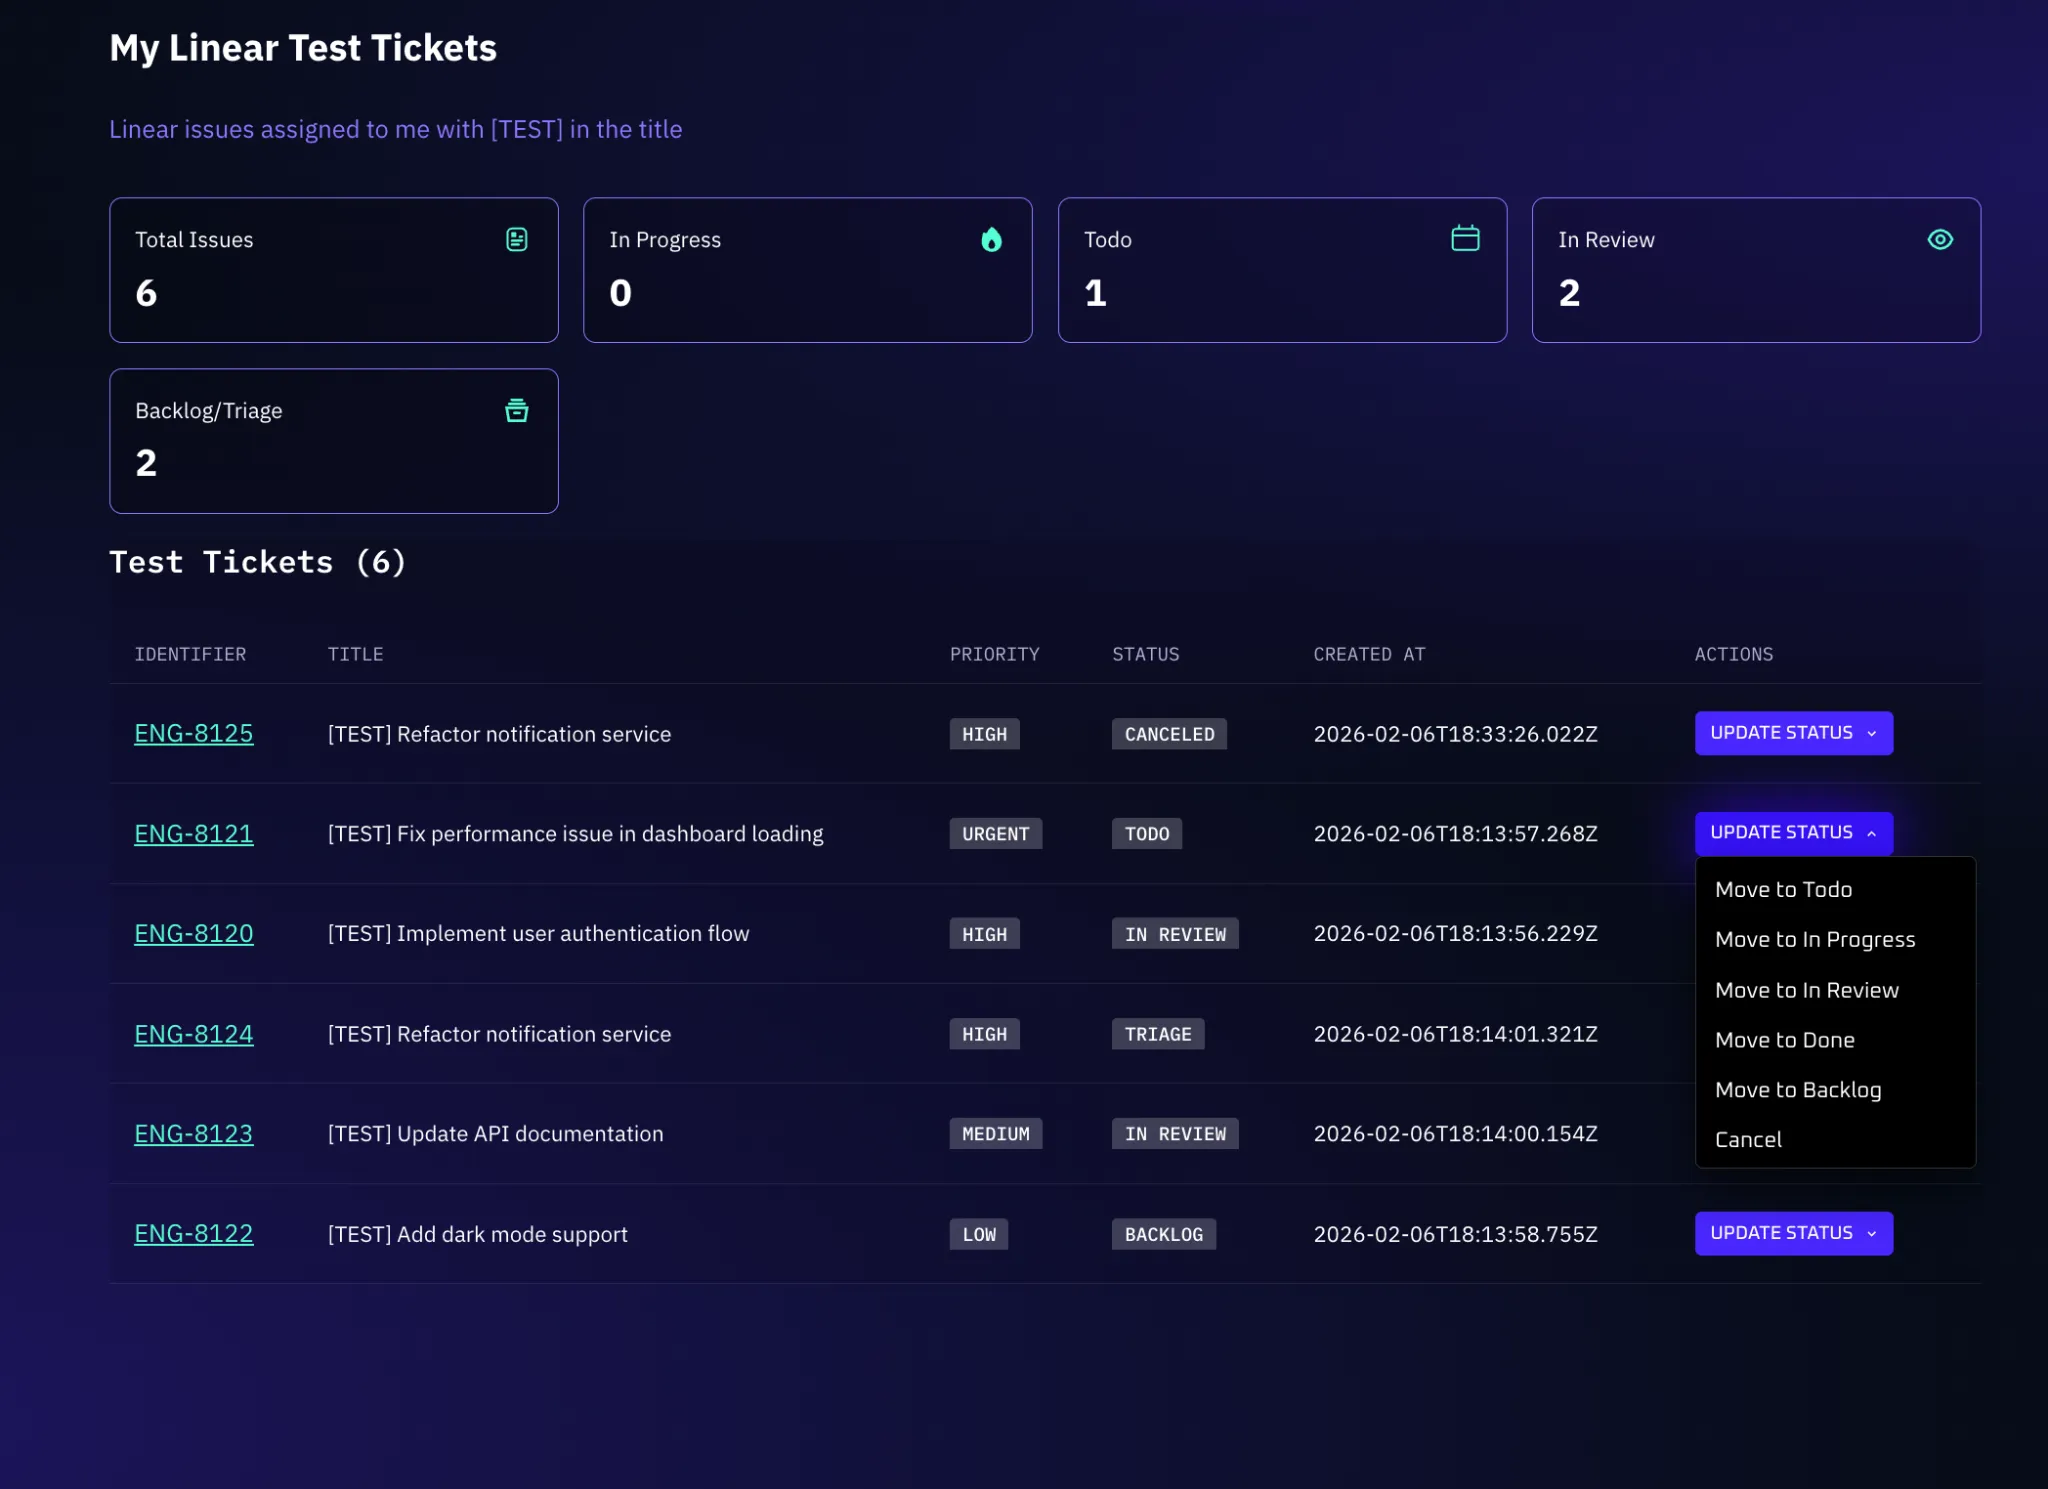
1. Prompt the AI to create test tickets and build a dashboard with inline actions:
Use the Linear tools to create test tickets assigned to me, then create a dashboard displaying them in a table with a column to update ticket status.
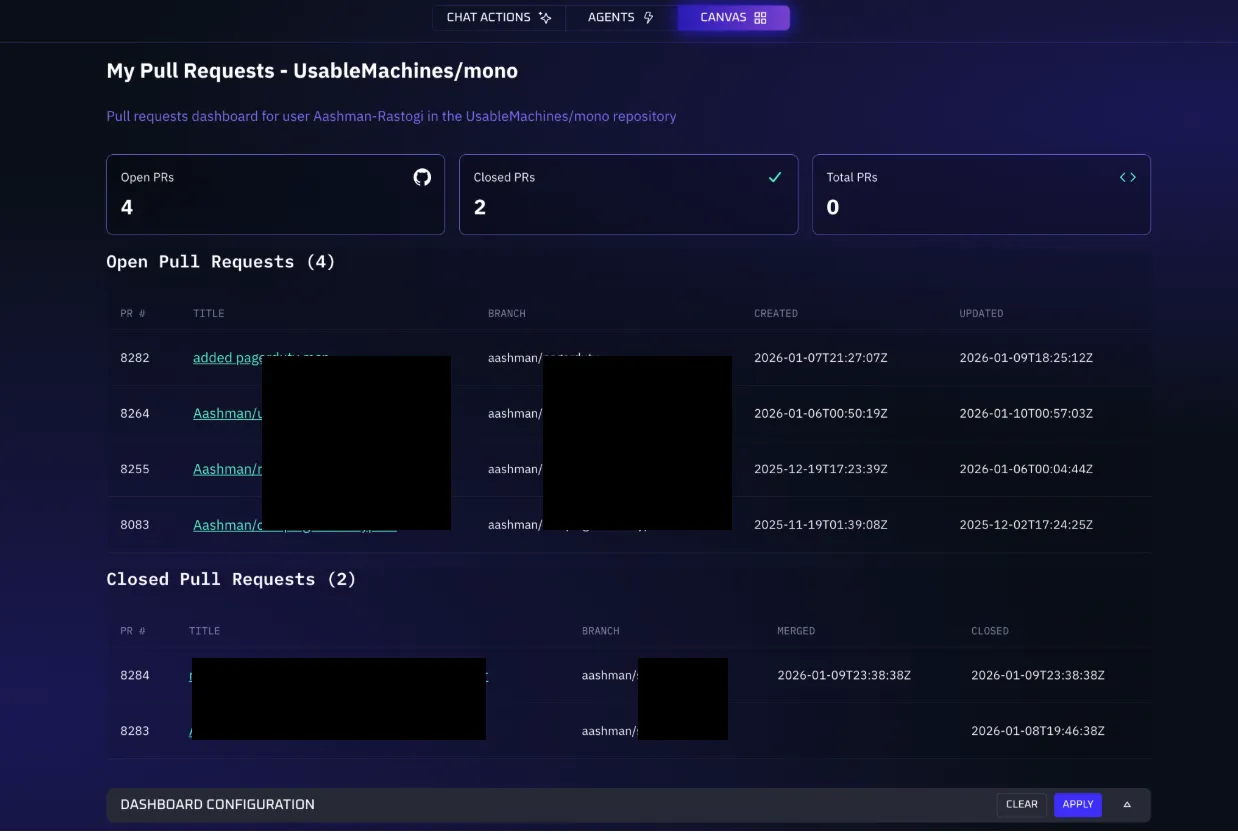
2. The AI creates the tickets and generates the dashboard:
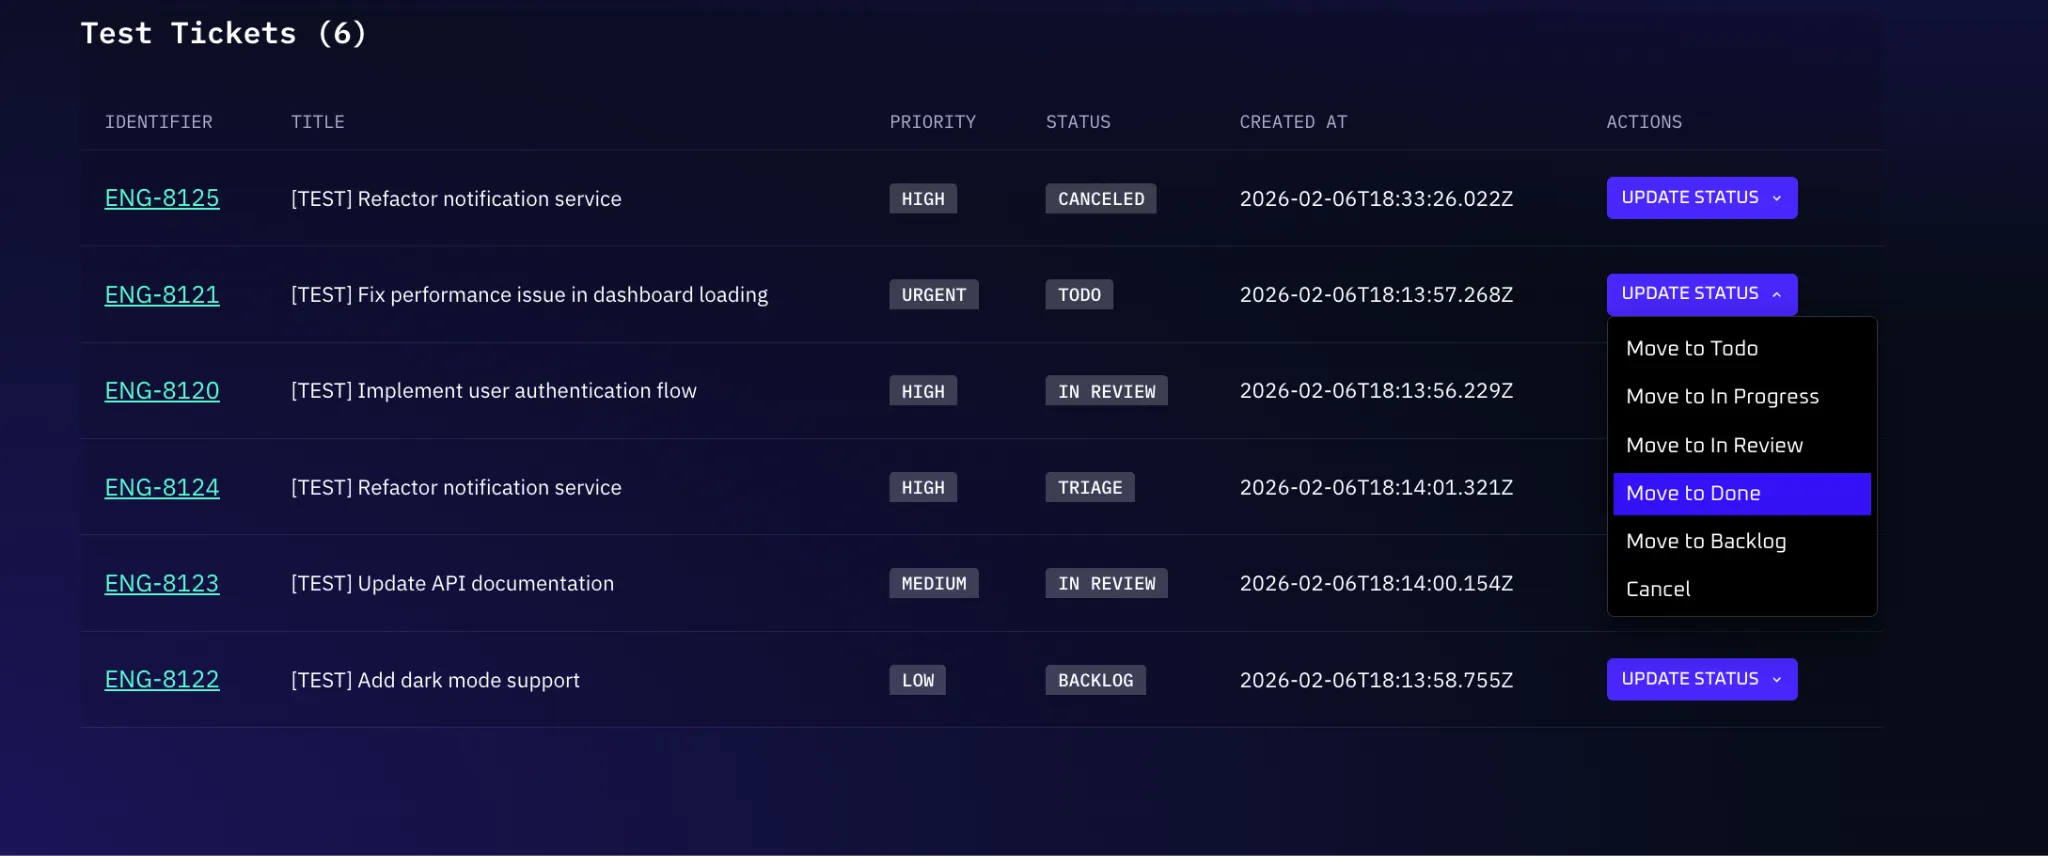
3. Perform an action — click “Update Status” on a ticket and select a new status:
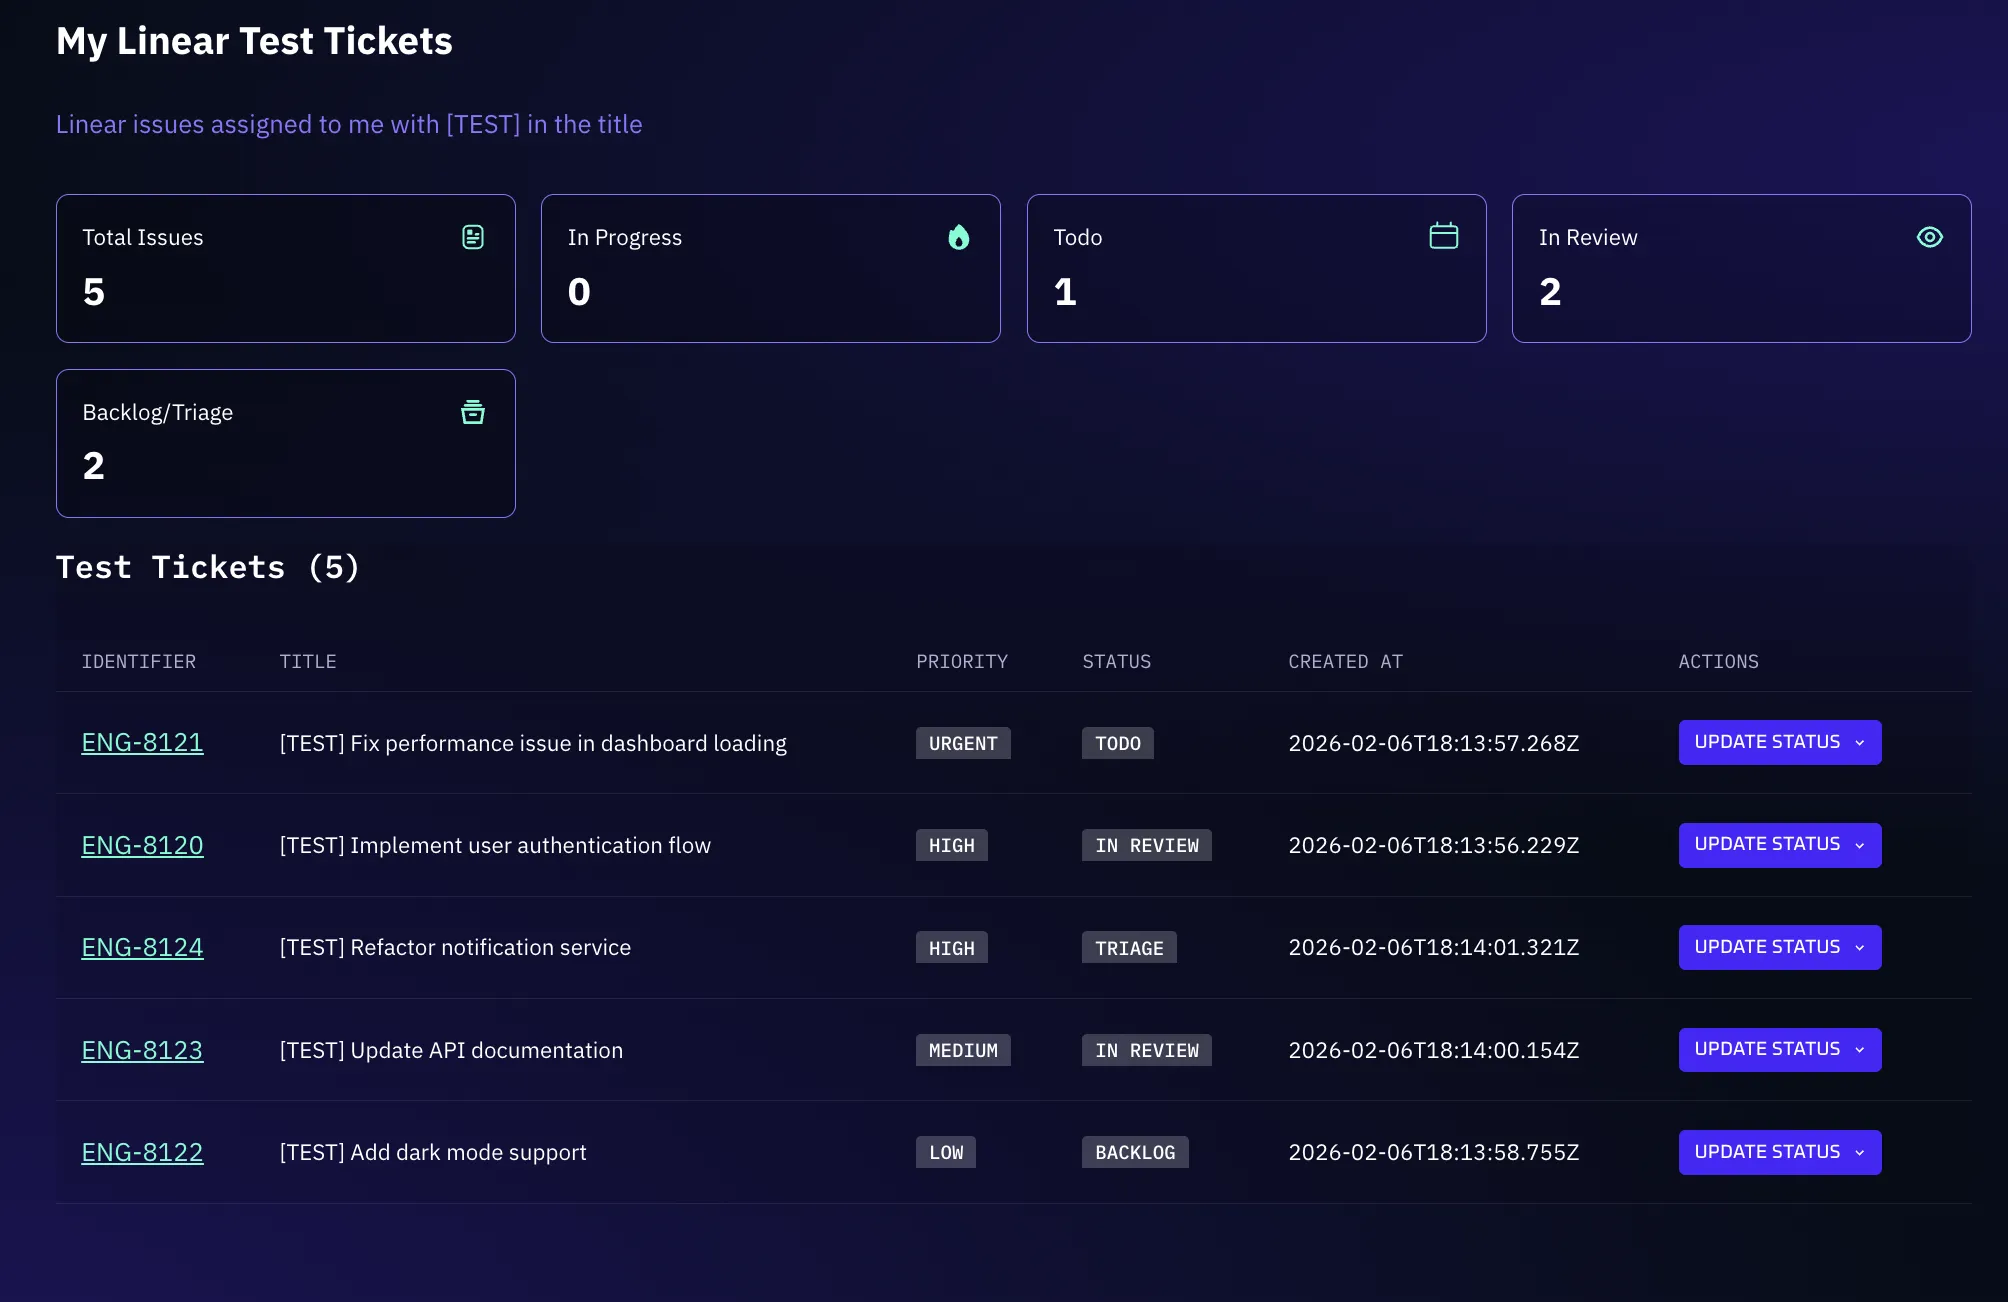
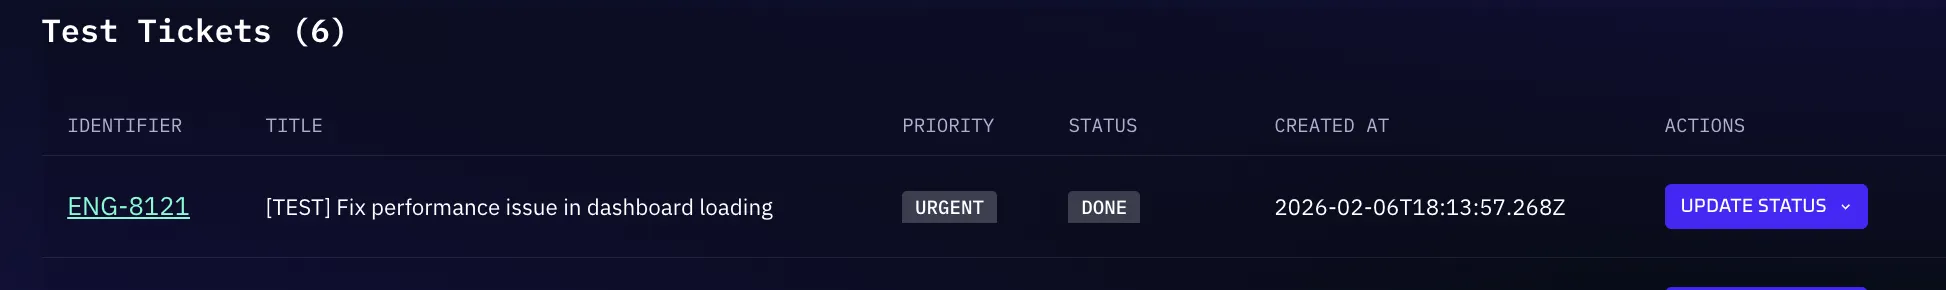
4. Changes reflect immediately on both the dashboard and the source system:
Chatting with Your Dashboard
From the Canvas page, you can start a chat with an AI agent that receives full context of your dashboard — including the complete configuration schema and the currently rendered data. This means the agent already knows your layout, data sources, columns, actions, and live values before you say anything.
You can:
- Ask questions — “Which issues have been open the longest?”
- Request modifications — “Add a column showing the assignee.”
- Perform edits — “Change the filter to only show high-priority items.”
- Get insights — “Summarize the status of my project based on this data.”
The agent makes real-time edits to your dashboard based on your conversation. To start, click the Start a Chat button in the dashboard sidebar.
Sidebar Chat History
The dashboard sidebar also includes a Chat History panel where you can reopen previous dashboard-related conversations.
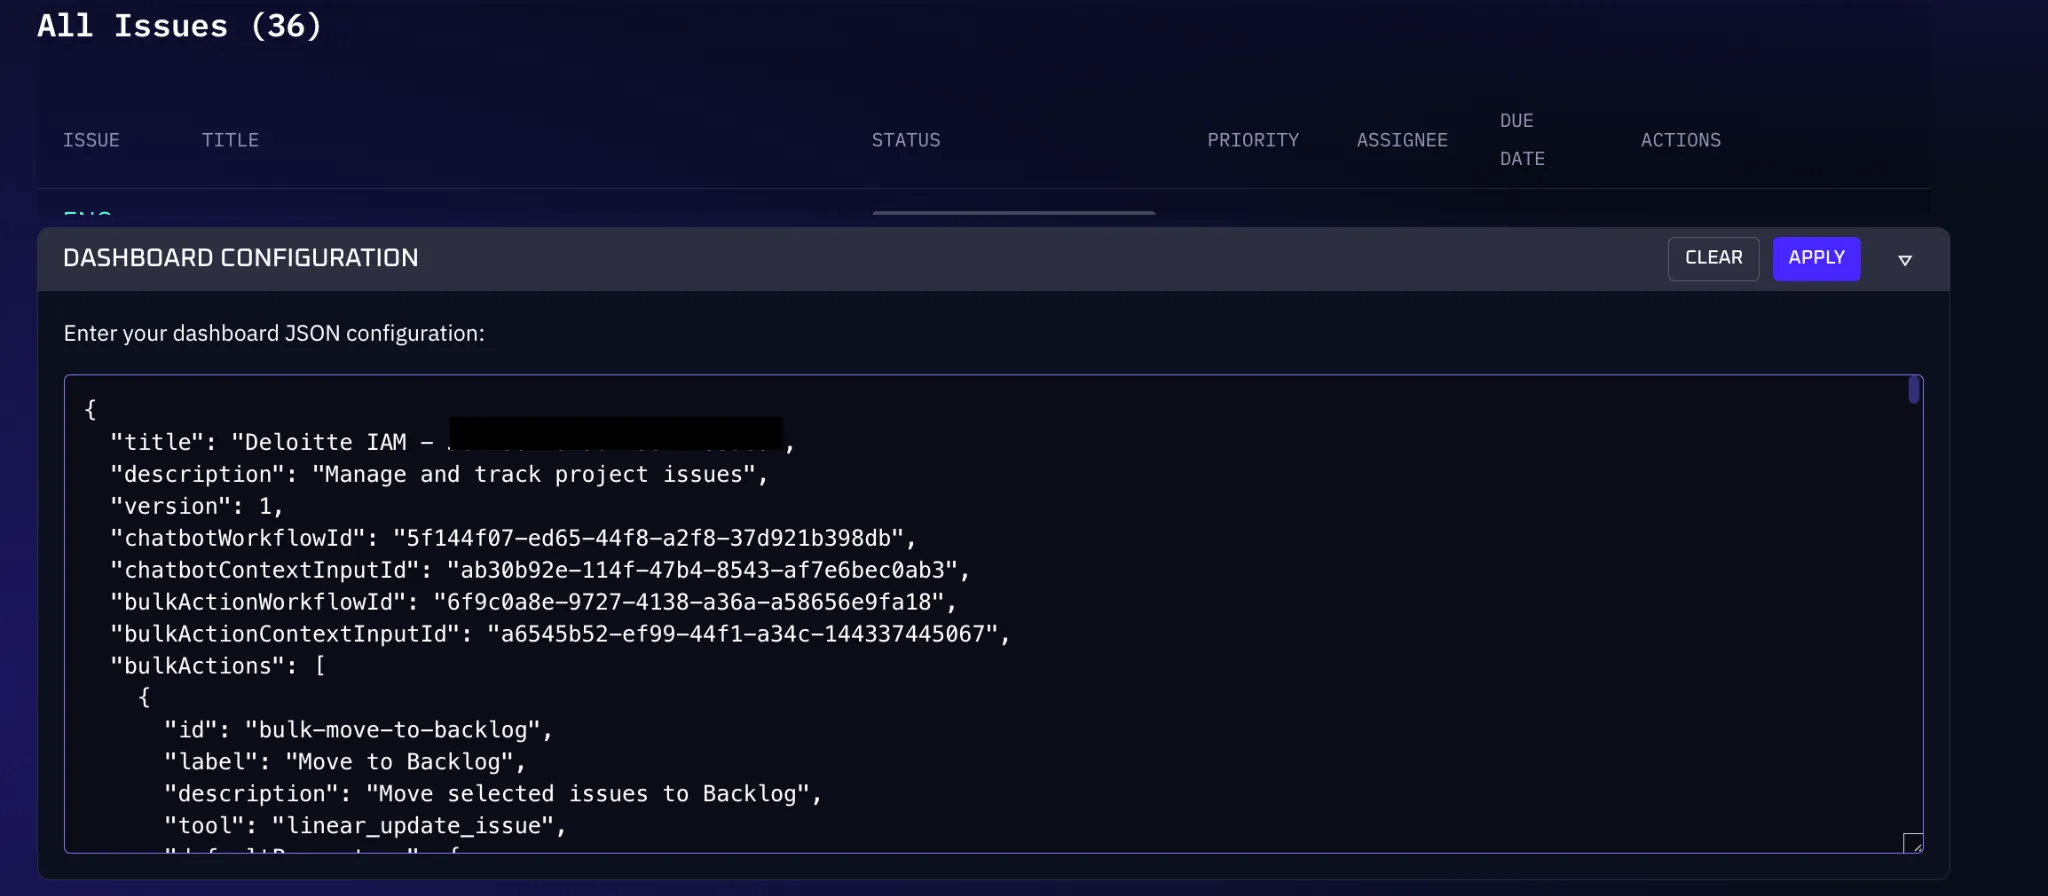
JSON Editor
For granular control, Canvas provides a JSON editor where you can directly modify the dashboard configuration:
- Navigate to the Canvas page.
- Open the JSON editor panel.
- Edit component properties (labels, titles, icons), actions, data sources, and transformation rules.
- Click Apply to update the dashboard.
FAQ
| Question | Answer |
|---|---|
| Why is my dashboard showing errors? | The data couldn’t be fetched from the integration. Check that your integration is still connected and you have permission to access the requested data. |
| Can I have multiple dashboards? | Yes — create as many as you need, each with different data sources and layouts. |
| How often does the data refresh? | Data is fetched when the page loads and is automatically refreshed after you perform an action (such as changing a status or executing a bulk action). You can also refresh the page manually to pull the latest data. |
| Can I share my dashboard? | Yes — sharing works the same way as sharing conversations in Kindo. |
Next Steps
- Set up Integrations to connect the data sources that power your dashboards
- Learn about AI Chat for the underlying conversational AI interface
- Create an Agent to automate workflows with your integration data